
Figure 1, Illustrates the distribution network and costs in £ per CPU[1] for transportation between factories and warehouses.
Source: Supply Chain Management Via, Module Coursework Assessment
- i) Transportation Model: North-West Method
North-West Start
Max = 3000
Chester to Glasgow Out
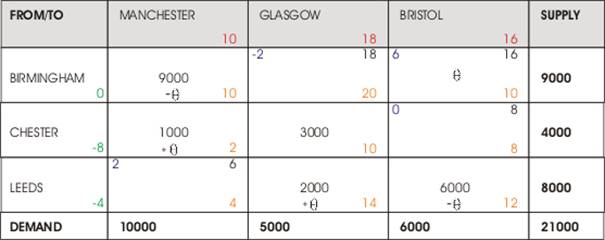
Figure 2, 1st Tableau
Leeds to Manchester In
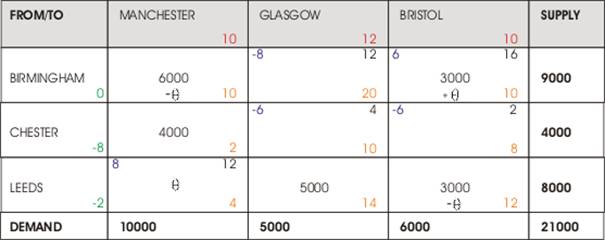
Max = 3000
Leeds to Bristol Out
Figure 3, 2nd Tableau
Chester to Glasgow
Max = 3000
Chester to Manchester Out
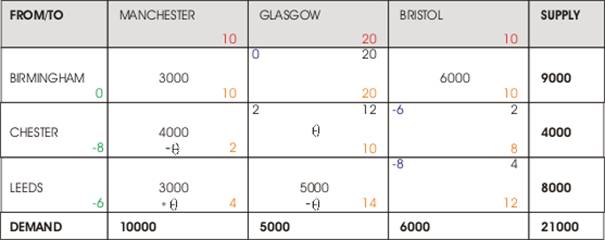
Figure 4, 3rd Tableau
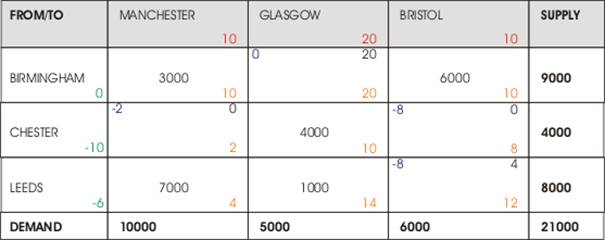
Figure 5, Final and 4th Tableau
Minimum
Cost = (3000*10) + (5000*10) + (4000*10) + (7000*4) + (1000*14)
= £30,000 + £60,000 + £40,000 + £28,000 + £14,000
= £172,000
Final Allocations are illustrated in Figure 6 below:
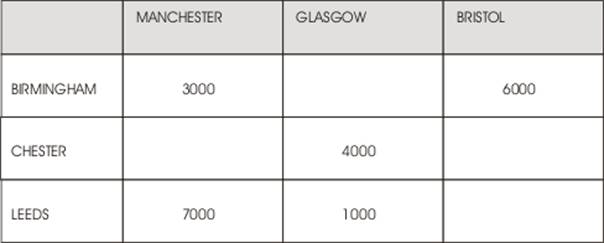
Figure 6, Final Allocations Tableau
- ii) Cost, Allocation and Dummy
| SUMMARY OF RESULTS FOR TEST Page:1 | |||
| FROM | TO | SHIPMENT | COST |
| BIRMINGHAM | MANCHESTER | 4000 | 10 |
| BIRMINGHAM | GLASGOW | 0 | 20 |
| BIRMINGHAM | BRISTOL | 5000 | 10 |
| CHESTER | MANCHESTER | 4000 | 2 |
| CHESTER | GLASGOW | 0 | 10 |
| CHESTER | BRISTOL | 0 | 8 |
| LEEDS | MANCHESTER | 2000 | 4 |
| LEEDS | GLASGOW | 0 | 14 |
| LEEDS | BRISTOL | 0 | 12 |
| DUMMY | MANCHESTER | 0 | 0 |
| DUMMY | GLASGOW | 5000 | 0 |
| DUMMY | BRISTOL | 1000 | 0 |
| MINIMIZED OBJ = 106000 INTERATION = 2 ELAPSED CPU SECOND = 1.75 | |||
Figure 7, Illustrates a minimum distribution of cost analysis carried out by theLeeds plant manager.
Source: Supply Chain Management Via, Module Coursework Assessment
Allocations and Cost
With respect to Figure 7 above, a decision to just manufacture 2000 CPUs per week for the next 4 weeks, shall inevitably pose a problem of allocation and distribution. This is simply because the supply does not meet demand. The Leeds plant manager can “deduce” from Figure 7 that by distributing all 2000 CPUs per week to the Manchesterplant would prove to be more cost effective than to it would be to send CPUs to Glasgow:
Manchester 2000(CPU) * 4(Cost) = £8000
Glasgow 2000(CPU) * 14(Cost) = £28,000
Bristol 2000(CPU) * 12(Cost) = £24,000
Manchester Vs Glasgow:
£28,000 – £8000 = £20,000
The Plant manager can make a £20,000 cost saving by sending the weekly supply of 2000 CPUs to Manchester rather than Glasgow.
Manchester Vs Bristol:
£24,000 – £8,000 = £16,000
The Plant manager can make a £16,000 cost-saving by sending the weekly supply of 2000 CPUs to Manchester rather than Bristol.
Dummy
Figure 7(Page 6), illustrates the Bristol Plant is not a cost-cutting alternative. Bristoldemands 1000 CPUs thus the cost would be:
Bristol (Dummy) 1000(CPU) * 12(Cost) = £12,000
However, the Leeds plant manager has the option of distribution to satisfying half of Manchester’s demand and all of Bristol’s by sending 1000 CPUs to Manchester and the remaining 1000 to Bristol. The cost of this allocation would be:
Manchester (1000*4) + Bristol (1000*12)
4,000 + 12,000 = £16,000
Manchester still remains the favourable option poised to receive the full supply of CPUs from Leeds. The plant manager will make a saving of £8000 if he or she decides to send all the 2000 CPUs to Manchester rather that to send 1000 CPUs to Manchester and 1000 to Bristol. The calculation is show below:
The 16,000 represents the cost of 1000 CPUs to Manchester and 1000 CPUs to Bristol.
The 8,000 represents the cost of 2000 CPUs to Manchester.
16,000 – 8,000 = £8,000
It is the Author’s opinion that a minimum distribution cost analysis has its limitation. We can derive that the Manchester factory is the most economically viable option available but, in the real world this decision will not be embraced with jubilation. This is because suppliers have a tendency to “look after” their best customers. Best customers are those who purchase regularly or in Glasgow’s case, who purchase the most. If Manchesterreceives all of the weekly supplies of CPUs, Glasgow and Bristol factories would be forced to seek alternative suppliers to meet their demands. In this process the Leeds Manager risks loosing the custom of Glasgow and Bristol not just for 4 weeks but foreverperhaps as the Glasgow and Bristol factories may be of the view that they were badly let down and do not wish to do business with a supplier who has accrued a record of failure.
iii) Justification for making 2000 CPUs a week for the next 4 weeks.
With respect to part (ii), the Leeds plant manager’s decision to manufacture just 2000 CPUs per week and distribute this supply to Manchester only, shows that this decision has been fundamentally based on a cost effective method. The virtue of this decision is that the full demand of the Manchester plant is met without any disruption during the shortage.
Drawing Justification from Experience
The Author has been a Web Consultant for many years and has managed, a global computer components retailer including CPUs. In the Leeds Managers decision, he or she is merely looking after his or her own survival. It does not stop there, due to shortage in the Market the Manchester plant may as the Author has experienced increase their prices for CPUs to take advantage of the crisis as the Manchester plant may be aware that customers cannot buy from elsewhere. The Author cannot say for sure the exact nature of the relationship between the Leeds plant manager and that of the Manchesterplant. It may be the case that the Leeds plant manager is acutely aware that the shortage would cause CPU prices to rise and thus seeks to benefit also. This benefit is capitalised fully by meeting Manchester’s full demand. This is because as explained in part (ii), Manchester is the most cost-effective method.
However there are alternatives that the Leeds plant manager might have investigated. These include the following:
Proportional Distribution
The weekly supply of 2000 CPUs can be distributed proportionally.
Manchester 500 (CPUs) * 4(Cost) = 2000
Glasgow 1250 (CPUs) * 14(Cost) = 5000
Bristol 250 (CPUs) * 12(Cost) = 3000
Total Cost of Proportional Distribution:
2000 + 5000 + 3000 = £10,000
Advantage of Proportional Distribution
- Although the demands are not met fully they haven’t been left out altogether. The factories have time to seek temporary suppliers. All factories receive supply for 4 weeks.
Disadvantage of Proportional Distribution
- It would be more cost-effective to send all 2000 CPUs to Manchester. As identified in part (ii) it would cost £8000, where as Proportional Distribution would cost a further £2000 per week.
Rotational Distribution
In this alternative the Leeds plant shall endeavour to meet the demands fully for each factory in turn. For example:
Week No.1: Distribute 2000 CPUs to Manchester
Week No.2: Distribute 5000 CPUs to Glasgow
Week No.3: Distribute 1000 CPUs to Bristol
Week No.4: Out of Stock.
Advantage of Rotational Distribution
- The demands of each factory are met fully for at least a week.
Disadvantage of Rotational Distribution
- This method is too fragmented. It cases disruption to all the factories and costs more than the minimum distribution cost analysis result (Sending all weekly 2000 CPUs to Manchester for a 4 week period). Factories receive no supply for three weeks.
One Week Distribution
In this alterative the Leeds pant shall meet the demands for each factory fully, but for only one week as there is only enough raw materials to manufacture 8000 CPUs.
Week No.1:
Manchester 2000 (CPUs)
Glasgow 5000 (CPUs)
Bristol 1000 (CPUs)
Advantage of One Week Distribution
- The demands to all three factories are fully for one week.
Disadvantage of One Week Distribution
This alternative costs more than the minimum distribution cost analysis result (Sending all weekly 2000 CPUs to Manchester for a 4 week period). Factories receive no supply for three weeks.
Irrespective of any alternative solutions, shortage in supply is certain. Alternative solutions cannot cure the shortage fully but, what they can do is ease and softens the impact of shortage in supply and give a degree of flexibility to the factories to seek temporary alternatives.